Northern Harrier at Hook Mountain

Northern Harrier

Hook Mountain

1971 - 2011

Northern Harrier at Hook Mountain

interpretation                                                                                  about the trend lines

The trend for Harriers seems to be leveling off in the last 10 years.

Interpretation (GRB):
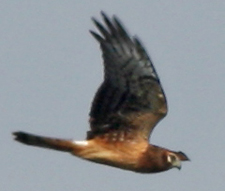
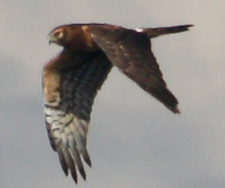
The Northern Harrier count for the 2019 season is 67% below the 10 year average and 77% below the long term average since 1971.   The trend line shows a decrease of almost 3 Harriers per year, over the 49 years, for a net loss of about 135.  This  suggests that we are counting 135 fewer Harriers on average than we counted at Hook in those early years, beginning in 1971.

N.Harrier Season at Hook

(Video:  NH at Hook)

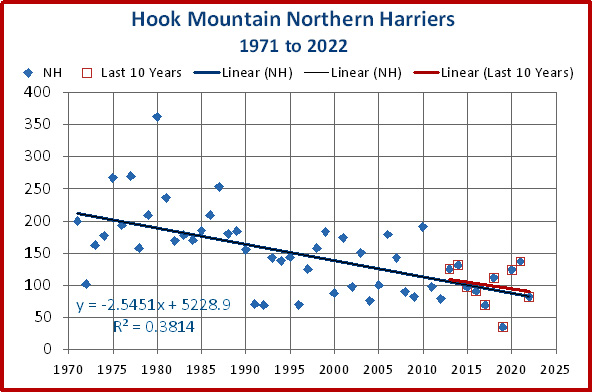
About the trend lines:

The trend lines have not been tested for significance. Their intent is to provide an overview of the general trend.   The graphs show two trend lines:  1971 - present, and the last 10 years.  The Hook Mountain Hawk Watch began in 1971, and the points with blue markers indicate the totals for all these years.  The points that show red squares around the blue markers represent the last ten years, showing the trend in this last decade.          more about trend lines . . . .
 
Species
American Kestrel Merlin Peregrine Falcon
Broad-winged Hawk Red-tailed Hawk Red-shouldered Hawk
Northern Harrier Black Vulture Turkey Vulture
Sharp-shinned Hawk Cooper's Hawk Northern Goshawk
Osprey Bald Eagle Golden Eagle

  
HOOK Since 1971 FIRE NEHW Videos Bat's Bytes

Updated 08/29/2022, Trudy Battaly